
DataChartにツールチップを表示するには、TooltipTemplateタグを埋め込むことにより対応可能です。
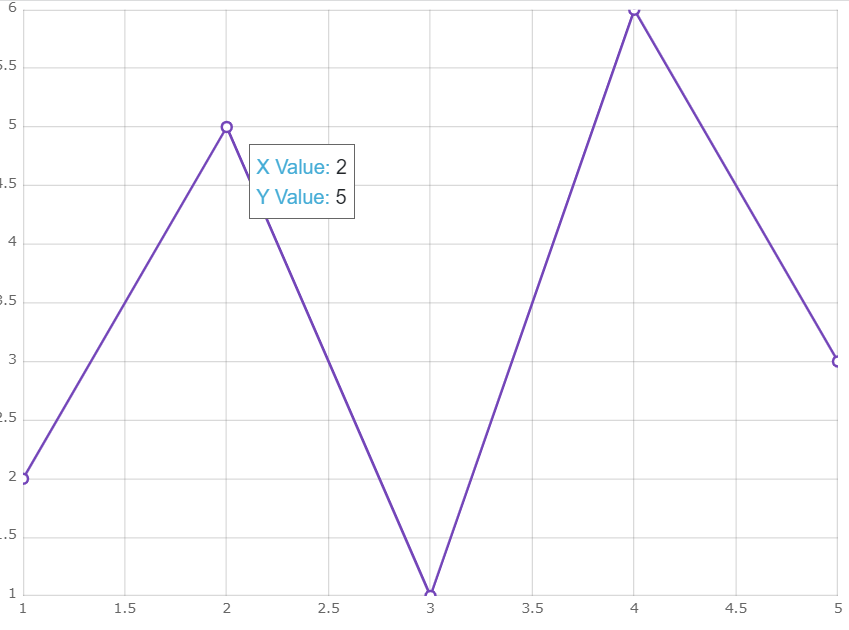
以下のサンプルコードでは、チャートのデータポイントにカーソルを移動した際に、データポイントの値を表示します。
<DataChart Height="500px" Width="700px">
    <NumericXAxis Name="xAxis" />
    <NumericYAxis Name="yAxis" />
    <ScatterLineSeries Name="series1"
                       XAxisName="xAxis"
                       YAxisName="yAxis"
                       XMemberPath="XValue"
                       YMemberPath="YValue"
                       DataSource="@DataSource"
                       MarkerType="MarkerType.Circle"
                       >
        <TooltipTemplate Context="context">
            <div >
                <span style="color: #44ACD6">
                    X Value:
                </span>
                <span>
                    @if ((context.Item as DataItem) != null)
                    {
                        @((context.Item as DataItem).XValue);
                    }
                </span>
                <br />
                <span style="color: #44ACD6">
                    Y Value:
                </span>
                <span >
                    @if ((context.Item as DataItem) != null)
                    {
                        @((context.Item as DataItem).YValue);
                    }
                </span>
            </div>
        </TooltipTemplate>
    </ScatterLineSeries>
</DataChart>
実行結果
サンプル