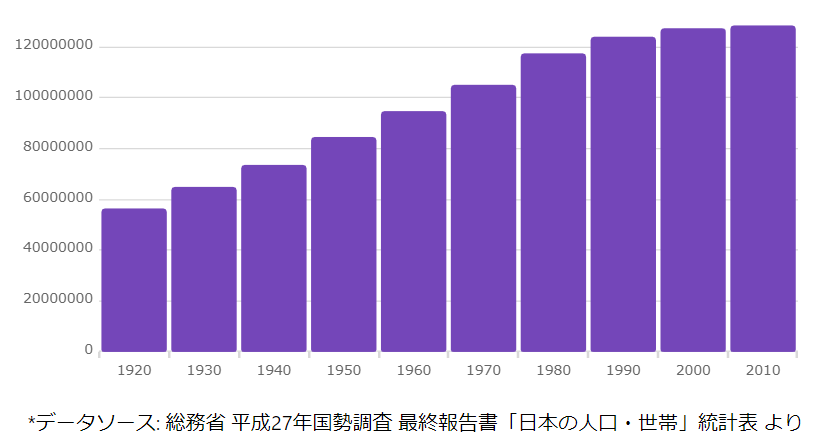
• オンライン ヘルプ
  • お問い合わせ
INFRAGISTICS ナレッジ ベース
  • オンライン ヘルプ
  • お問い合わせ

IgrDataChart 棒グラフのサンプル

  • 公開日: 2021/04/08
  • 最終更新日: 2021/04/08

IgrDataChartで棒グラフを作成したサンプルです。

プロンプトで、

  • npm install
  • npm start

で実行できます。


サンプル

kb5583-app1ダウンロード


Tagged: IgrDataChart

Related Articles

  • IgrGrid でテンプレート機能を使用する

  • IgrGrid で条件付きの行選択機能を実装する

  • IgrGrid – 行ごとに編集や削除を制御する方法

  • IgrGrid – 非表示列を含めて Excel にエクスポートする

  • IgrGrid – 特定の条件でセル編集を制御したい

  • IgrGrid – エクスポートファイル名を指定したい

カテゴリー

  • App Builder 1
  • Ultimate UI for WPF 311
  • Ultimate UI for Windows Forms 199
  • Ultimate UI for ASP.NET 79
  • Ignite UI for jQuery 141
  • Ignite UI for Angular 251
  • Ignite UI for Blazor 181
  • Ignite UI for React 51
  • Ignite UI for Web Components 19
  • Reveal 6
  • Indigo.Design 8
  • Ultimate UI for Xamarin 10
  • Silverlight 1
  • その他 31

タグ

Application Styling Framework Excel General Icon IgbButton IgbCategoryChart IgbDialog IgbFinancialChart IgbForm IgbInput IgbTab IgbTabPanel IgcDataChart igxButton IgxCategoryChart IgxDataChart IgxDatePicker igxDateRangePicker IgxDrag IgxGrid IgxNavbar IgxRadio IgxSlider igxTimePicker TextField UltraChart UltraComboEditor UltraDayView UltraGanttView UltraGrid UltraTimelineView UltraWebChart UltraWinEditors WebDataGrid WebDataMenu WebHierarchicalDataGrid XamDataChart XamDataTree XamDateTimeEditor XamDockManager XamNumericSlider XamRichTextEditor XamSpreadsheet XamTabControl XamTileManager
© Copyright INFRAGISTICS. All Rights Reserved