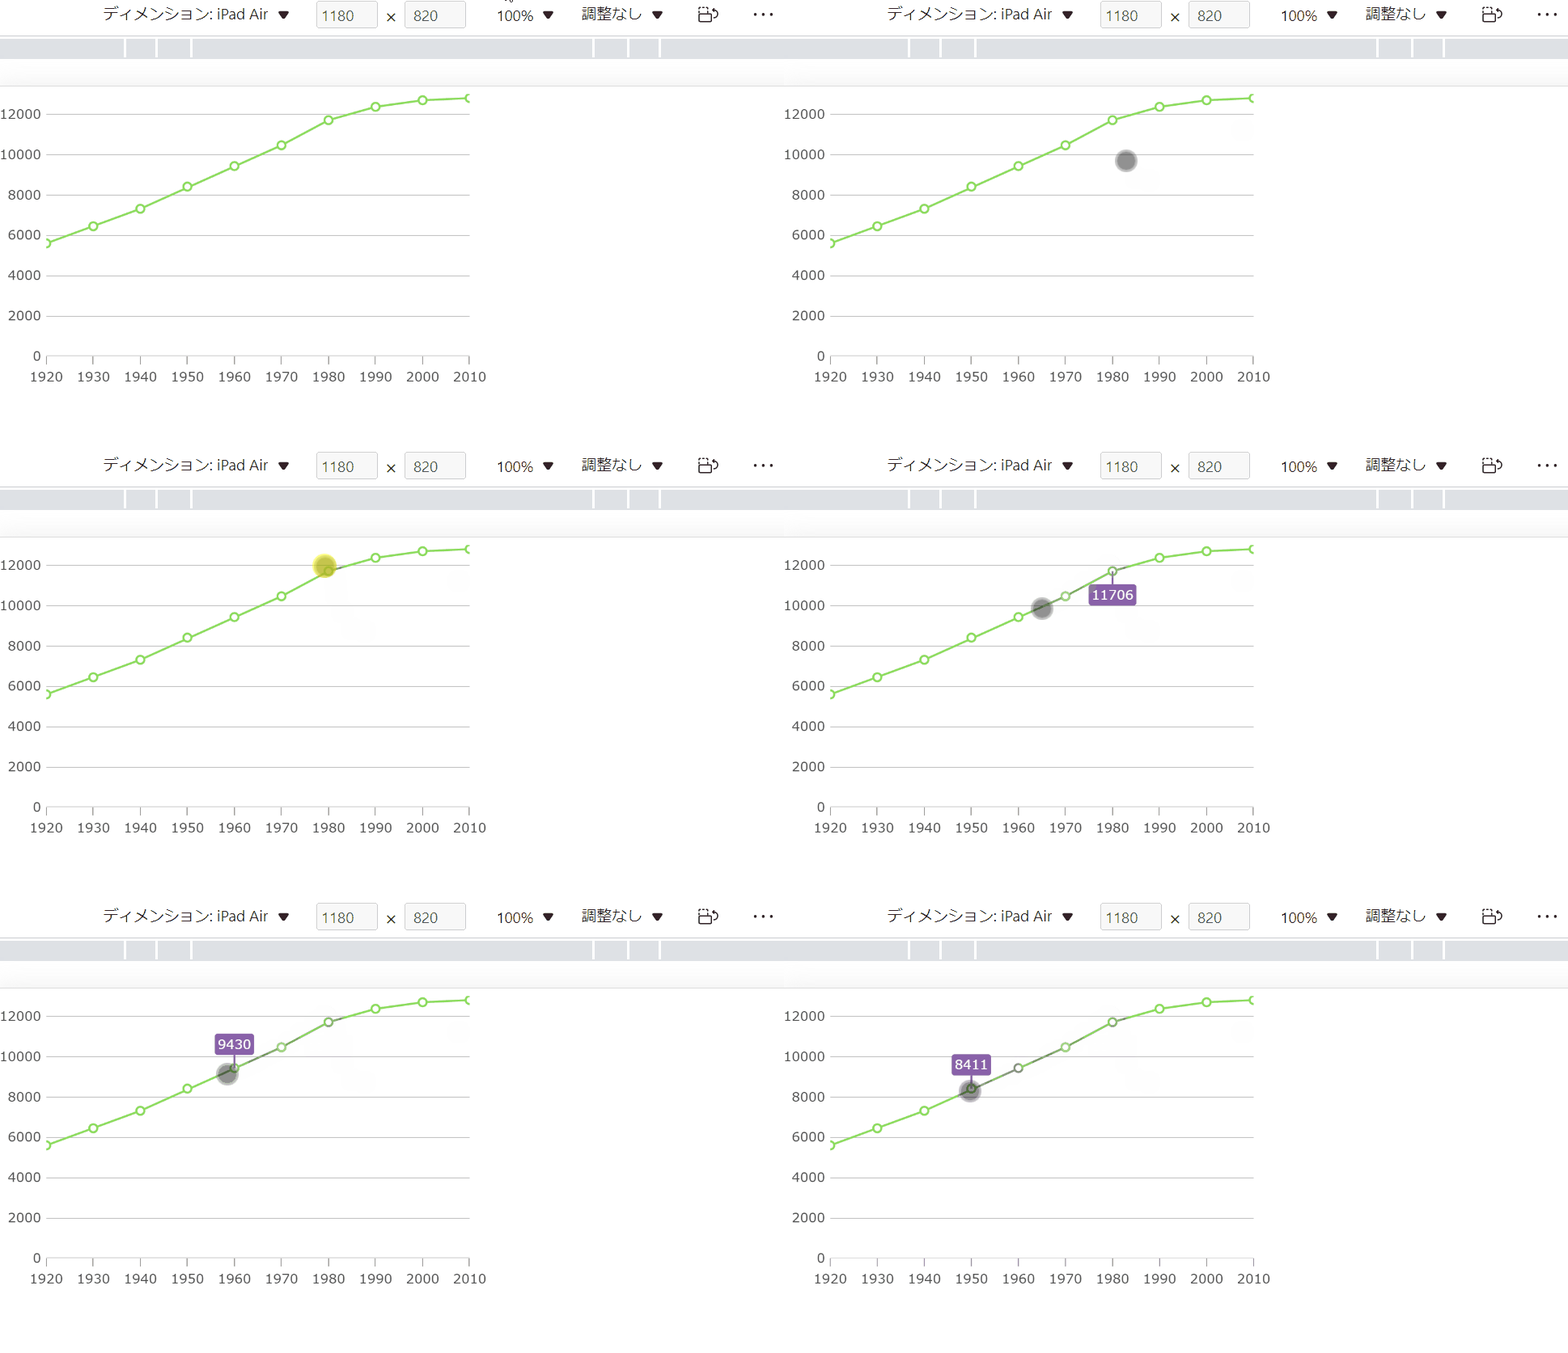
IgrDataChart では、マウス位置にあるデータポイントに対応するツールチップを表示する機能が備わっています。この機能を有効にするには、シリーズの showDefaultTooltip プロパティに true を設定します。
ただし、デスクトップデバイスなどの、マウスカーソルでの操作が前提となる環境では、マウスホバーに応じてツールチップが表示されるのですが、タッチデバイスではマウスカーソル(マウス操作)の概念がないため、IgrDataChart をロングタップ(タッチアンドホールド)することでツールチップを表示します。
ただし、ユーザーの利用環境によっては、ロングタップよりも、タッチでツールチップを表示したい局面もあります。そのような場合、回避策として、CalloutLayer を組み合わせる方法があります。なお、この回避策では、デスクトップデバイスにおいても、タッチデバイスと同様に、データポイントのクリックでツールチップを表示することができます。
実装のポイントとしては、seriesMouseLeftButtonDown イベントを捕捉し、クリックされたデータポイントの情報を CalloutLayer に登録するところです。実装コードは下記のとおりです。
import React, { useState } from "react";
import "./App.css";

import {
  IgrCalloutLayer,
  IgrDataChartAnnotationModule,
  IgrDataChartInteractivityModule,
  IgrDataChartMouseButtonEventArgs,
  IgrNumericYAxis,
} from "igniteui-react-charts";
import { IgrCategoryXAxis } from "igniteui-react-charts";

import { IgrLineSeries } from "igniteui-react-charts";
import { IgrDataChart } from "igniteui-react-charts";
import { IgrDataChartCoreModule } from "igniteui-react-charts";
import { IgrDataChartCategoryModule } from "igniteui-react-charts";

IgrDataChartCoreModule.register();
IgrDataChartCategoryModule.register();
IgrDataChartInteractivityModule.register();
IgrDataChartAnnotationModule.register();

function App() {
  const [useCallout, setUseCallout] = useState([{}]);

  const onSeriesLeftButtonDown = (
    s: any,
    e: IgrDataChartMouseButtonEventArgs
  ) => {
    const chart = e.chart as IgrDataChart;
    const dataSource = chart.dataSource as [];
    const dataSourceIndex = dataSource.findIndex((elem) => elem === e.item);
    const callout = dataSource[dataSourceIndex] as any;
    if (callout === undefined || callout.Population === undefined) {
      return;
    }
    // クリックもしくはタップされたデータポイントの情報を、コールアウトレイヤーに登録する。
    setUseCallout([{ Index: dataSourceIndex, Value: callout.Population }]);
  };

  const data = [
    { Year: "1920", Population: 5596 },
    { Year: "1930", Population: 6445 },
    { Year: "1940", Population: 7311 },
    { Year: "1950", Population: 8411 },
    { Year: "1960", Population: 9430 },
    { Year: "1970", Population: 10461 },
    { Year: "1980", Population: 11706 },
    { Year: "1990", Population: 12367 },
    { Year: "2000", Population: 12693 },
    { Year: "2010", Population: 12802 },
  ];

  return (
    <div className="App">
      <IgrDataChart
        dataSource={data}
        width="500px"
        height="300px"
        seriesMouseLeftButtonDown={onSeriesLeftButtonDown}
      >
        {/* 軸 */}
        <IgrCategoryXAxis name="xAxis" label="Year" />
        <IgrNumericYAxis name="yAxis" minimumValue="0" />
        {/* シリーズ */}
        <IgrLineSeries
          name="series1"
          xAxisName="xAxis"
          yAxisName="yAxis"
          valueMemberPath="Population"
          // showDefaultTooltip={true} //デフォルトのツールチップ表示機能
        />
        <IgrCalloutLayer
          name="series2"
          dataSource={useCallout}
          xMemberPath="Index"
          yMemberPath="Value"
          labelMemberPath="Value"
          // ...
        ></IgrCalloutLayer>
      </IgrDataChart>
    </div>
  );
}

export default App;
