seriesMouseLeftButtonDown イベントを利用することで、クリックしたポイントのデータを取得することが可能です。
チャートの設定
クリックしたデータ要素を取得するには、IgrDataChart の seriesMouseLeftButtonDown イベントをハンドルします。イベント引数 IgrDataChartMouseButtonEventArgs から以下の情報を取得できます。
- e.item : クリックされたデータ要素のオブジェクト
- e.series : クリックされたシリーズ情報(title など)
以下の例では、クリック時に 年度・国名・値 を取得し、画面下部に表示します。
const onclicked = (s: IgrSeriesViewer, e: IgrDataChartMouseButtonEventArgs) => {
    const year = e.item?.year;
    const title = e.series?.title;
    if (!year || !title) return;
    const value = e.item[title.toLowerCase()];
    setClickedYear(year);
    setClickedCountry(title);
    setClickedValue(value);
};
チャートにイベントを設定する方法は以下の通りです。
<IgrDataChart
  ...
  seriesMouseLeftButtonDown={onclicked}>
</IgrDataChart>
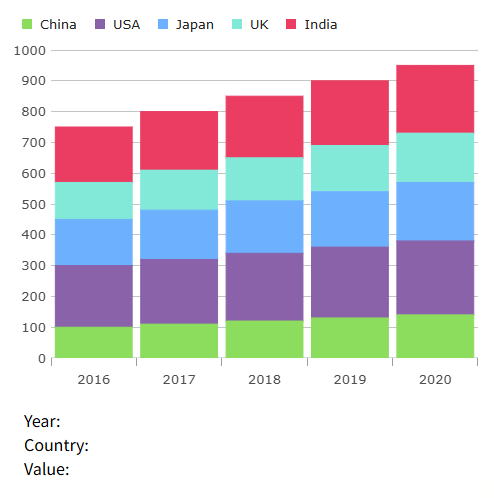
実行結果
チャートの任意のデータ要素をクリックすると、クリックした 年度・国名・値 が下部に表示されます。
ダウンロード後、以下のコマンドで実行できます。
npm ci
npm run dev