Silverlight と WPF を対象とする Infragistics XamDataChart では、バインドした項目のプロパティに基づいてマーカーの外観が異なるシリーズを作成できます。
ScatterSeries、RangeColumnSeries などの MarkerSeries で MarkerTemplate プロパティを使用することができます。UI 要素のプロパティが項目の DataContext プロパティにバインドされるカスタム DataTemplate を作成できます。
<DataTemplate x:Key="bubbleTemplate" >

    <Ellipse Stretch="Fill"

               HorizontalAlignment="Stretch"

               VerticalAlignment="Stretch"

               StrokeThickness="0.5"

               MinWidth="10" MinHeight="10"

               Width="{Binding Item.Width}"

               Height="{Binding Item.Width}">

        <ToolTipService.ToolTip>

            <StackPanel Orientation="Vertical">

                <TextBlock Text="{Binding Item.YValue, StringFormat='Value: {0}'}" />

            </StackPanel>

        </ToolTipService.ToolTip>

    </Ellipse>

</DataTemplate>
RgbValueConverter は、数値を連続色パレットの SolidColorBrush に変換します。
項目の DataContext の値に基づいてマーカーの色を変更する場合があります。値は別のタイプが可能です。値を指定したタイプから特定の色の Brush に変換するために ValueConverter が必要です。
この記事では 数値型から個別の色パレットに変換、または数値型から連続色パレットに変換する 2 種類のコンバーターを紹介します。
サンプル アプリケーションでは Silverlight を対象としています。WPF の XamDataChart を使用すると、同じように WPF アプリケーションを作成できます。
サンプルアプリケーション作成の要件:
ソフトウェア:
- Visual Studio 2010
- NetAdvantage for Silverlight Data Visualization (このサンプルは 2010.2 バージョン) の Infragistics XamMap コンポーネント
作成手順:
Silverlight の場合:
- Silverlight アプリケーションを作成します。
- ValueConverter を作成します。NumberToBrush は数値から個別の色パレットの Brush に変換します。RgbValueConverter は数値から連続色パレットの Brush に変換します。ほとんどのコンポーネントでは Background、Stroke などのプロパティで Brush が使用されます。
- XamDataChart の DataContext で使用されるサンプル データを作成します。
- 丸を表す MarkerTemplate を作成します。色は YValue プロパティにバインドされます。ここでは 2 つのコンバーターを使用します。
- 作成した MarkerTemplate 定義を使用して、散布図シリーズの XamDataChart を作成します。
- サンプル アプリケーションを実行します。
1. Visual Studio 2010 で Silverlight アプリケーションを作成します。
2. 2 つの ValueConverter を追加します。
NumberToBrush は数値 (double 型) を SolidColorBrush に変換します。Brush は個別の色パレットから取得される色です。パレットには 6 つの SolidColorBrush があります。色は白い、赤い、オレンジ、黄色、緑、と青です。パラメーターであるため、範囲があり、コンバーターは数値に相対する SolidColorBrush を返します。値が範囲外にある場合、白い SolidColorBrush を返します。
public sealed class NumberToBrush : IValueConverter

{


    private Brush[] _brushes = new Brush[] { new SolidColorBrush(Colors.White),

                                            new SolidColorBrush(Colors.Red),

                                            new SolidColorBrush(Colors.Orange),

                                            new SolidColorBrush(Colors.Yellow),

                                            new SolidColorBrush(Colors.Green),

                                            new SolidColorBrush(Colors.Blue)};


    #region Property Accessors


    public Brush[] Brushes

    {

        get { return this._brushes; }

        set { this._brushes = value; }

    }


    #endregion


    #region IValueConverter


    public object Convert(object value, Type targetType, object parameter,

        System.Globalization.CultureInfo culture)

    {


        if ((typeof(Brush) != targetType || typeof(double) != value.GetType()))

        {

            return null;

        }


        Range range = parameter as Range;

        if(range == null)

        {

            range = new Range();

            range.Min = 0;

            range.Max = 10;

        }


        var i = (double)value;


        double interval = (double)(range.Max - range.Min)/(_brushes.Length - 1);

        int index = (int)(i / interval + 0.5);


        if (index <= 0 || index >= this._brushes.Length) return this._brushes[0];


        return this._brushes[index];

    }


    public object ConvertBack(object value, Type targetType, object parameter,

        System.Globalization.CultureInfo culture)

    {

        throw new NotImplementedException();

    }


    #endregion

}


public class Range : BaseViewModel

{

    #region Min


    private int _min;

    public int Min

    {

        get { return this._min; }

        set

        {

            this._min = value;

            OnPropertyChanged("Min");

        }

    }


    #endregion // Min


    #region Max


    private int _max;

    public int Max

    {

        get { return this._max; }

        set

        {

            this._max = value;

            OnPropertyChanged("Max");

        }

    }


    #endregion // Max


}
コンバーターは HSV (Hue-Saturation-Value) を使用します。
http://ja.wikipedia.org/wiki/HSV%E8%89%B2%E7%A9%BA%E9%96%93
詳細について、Wikipedia リンクを参照してください。
RgbValueConverter では、数値は Min と Max 値の範囲内で正規化されます。
var normValue = i * 360/(range.Max – range.Min);
RgbValueConverter のコードは以下です。
public sealed class RgbValueConverter : IValueConverter

{


    private static Color ColorFromHsv(double hue, double saturation, double value)

    {

        int hi = (int)(Math.Floor(hue / 60)) % 6;

        double f = hue / 60 - Math.Floor(hue / 60);


        value = value * 255;

        int v = (int)(value);

        int p = (int)(value * (1 - saturation));

        int q = (int)(value * (1 - f * saturation));

        int t = (int)(value * (1 - (1 - f) * saturation));


        if (hi == 0)

        {

            return Color.FromArgb(255, (byte)v, (byte)t, (byte)p);

        }


        if (hi == 1)

        {

            return Color.FromArgb(255, (byte)q, (byte)v, (byte)p);

        }


        if (hi == 2)

        {

            return Color.FromArgb(255, (byte)p, (byte)v, (byte)t);

        }


        if (hi == 3)

        {

            return Color.FromArgb(255, (byte)p, (byte)q, (byte)v);

        }


        if (hi == 4)

        {

            return Color.FromArgb(255, (byte)t, (byte)p, (byte)v);

        }


        return Color.FromArgb(255, (byte)v, (byte)p, (byte)q);

    }


    #region IValueConverter


    public object Convert(object value, Type targetType, object parameter,

        System.Globalization.CultureInfo culture)

    {


        if ((typeof(Brush) != targetType || typeof(double) != value.GetType()))

        {

            return null;

        }


        Range range = parameter as Range;

        if(range == null)

        {

            range = new Range();

            range.Min = 0;

            range.Max = 10;

        }


        var i = System.Convert.ToDouble(value);


        if (i <= range.Min || range.Min >= range.Max)

        {

            return new SolidColorBrush(Colors.White);

        }


        var normValue = i * 360/(range.Max - range.Min);


        return new SolidColorBrush(ColorFromHsv(normValue, 1, 1));


    }


    public object ConvertBack(object value, Type targetType, object parameter,

        System.Globalization.CultureInfo culture)

    {

        throw new NotImplementedException();

    }


    #endregion


}
3. XamDataChart の DataContext で使用されるサンプル データを作成します。
public class BubbleDataCollection

        : ObservableCollection<BubblePoint>

{


    public BubbleDataCollection()

    {

        this.Add(new BubblePoint { XValue = 4, YValue = 10, Width = 30 });

        this.Add(new BubblePoint { XValue = 4, YValue = 4, Width = 40 });

        this.Add(new BubblePoint { XValue = 8, YValue = 8, Width = 20 });

        this.Add(new BubblePoint { XValue = 10, YValue = 1, Width = 50 });

        this.Add(new BubblePoint { XValue = 1, YValue = 10, Width = 40 });

    }


}


public class BubblePoint

{

    public double XValue { get; set; }

    public double YValue { get; set; }

    public double Width { get; set; }

}
    <UserControl.Resources>

        ...

        <XamDataChartCustomTemplatesDemo:BubbleDataCollection x:Key="bubbleCollection" />

       ....

    <Grid x:Name="LayoutRoot" Background="White" DataContext="{StaticResource bubbleCollection}">
4. 丸を表す MarkerTemplate を作成します。色は YValue プロパティにバインドされます。ここでは 2 つのコンバーターを使用します。
<UserControl.Resources>

    <Converters:NumberToBrush x:Key="indexToBrush"/>

    <Converters:RgbValueConverter x:Key="RgbToBrush"/>

    <XamDataChartCustomTemplatesDemo:BubbleDataCollection x:Key="bubbleCollection" />

    <Converters:Range x:Key="range" Min="0" Max="10"/>

    <DataTemplate x:Key="bubbleTemplate" >

        <Ellipse Stretch="Fill"

                   HorizontalAlignment="Stretch"

                   VerticalAlignment="Stretch"

                   Fill="{Binding Item.YValue, Converter={StaticResource indexToBrush}, ConverterParameter={StaticResource range}}"

                   Stroke="{Binding Series.ActualMarkerOutline}"

                   StrokeThickness="0.5"

                   MinWidth="10" MinHeight="10"

                   Width="{Binding Item.Width}"

                   Height="{Binding Item.Width}">

            <ToolTipService.ToolTip>

                <StackPanel Orientation="Vertical">

                    <TextBlock Text="{Binding Item.YValue, StringFormat='Value: {0}'}" />

                </StackPanel>

            </ToolTipService.ToolTip>

        </Ellipse>

    </DataTemplate>

    <DataTemplate x:Key="bubbleTemplate2" >

        <Ellipse Stretch="Fill"

                   HorizontalAlignment="Stretch"

                   VerticalAlignment="Stretch"

                   Fill="{Binding Item.YValue, Converter={StaticResource RgbToBrush}, ConverterParameter={StaticResource range}}"

                   Stroke="{Binding Series.ActualMarkerOutline}"

                   StrokeThickness="0.5"

                   MinWidth="10" MinHeight="10"

                   Width="{Binding Item.Width}"

                   Height="{Binding Item.Width}">

            <ToolTipService.ToolTip>

                <StackPanel Orientation="Vertical">

                    <TextBlock Text="{Binding Item.YValue, StringFormat='Value: {0}'}" />

                </StackPanel>

            </ToolTipService.ToolTip>

        </Ellipse>

    </DataTemplate>

</UserControl.Resources>
MarkerTemplate 定義は BubblePoint オブジェクトの YValue に基づいて Brush で塗りつぶされた楕円を含みます。
5. 作成した MarkerTemplate 定義を使用して、散布図シリーズの XamDataChart を作成します。
<igChart:XamDataChart x:Name="theChart">
<igChart:XamDataChart.Axes>
<igChart:NumericXAxis x:Name="xAxis"
MinimumValue="0" MaximumValue="15"/>
<igChart:NumericYAxis x:Name="yAxis"
MinimumValue="0" MaximumValue="15"/>
</igChart:XamDataChart.Axes>
<igChart:XamDataChart.Series>
<igChart:ScatterSeries x:Name="scatter"
MarkerTemplate="{StaticResource bubbleTemplate}"
ItemsSource="{Binding}"
XMemberPath="XValue"
YMemberPath="YValue"
XAxis="{Binding ElementName=xAxis}"
YAxis="{Binding ElementName=yAxis}"></igChart:ScatterSeries>
</igChart:XamDataChart.Series>
</igChart:XamDataChart>
...
<igChart:XamDataChart x:Name="theChart2">
<igChart:XamDataChart.Axes>
<igChart:NumericXAxis x:Name="xAxis2"
MinimumValue="0" MaximumValue="15"/>
<igChart:NumericYAxis x:Name="yAxis2"
MinimumValue="0" MaximumValue="15"/>
</igChart:XamDataChart.Axes>
<igChart:XamDataChart.Series>
<igChart:ScatterSeries x:Name="scatter2"
MarkerTemplate="{StaticResource bubbleTemplate2}"
ItemsSource="{Binding}"
XMemberPath="XValue"
YMemberPath="YValue"
XAxis="{Binding ElementName=xAxis2}"
YAxis="{Binding ElementName=yAxis2}"></igChart:ScatterSeries>
</igChart:XamDataChart.Series>
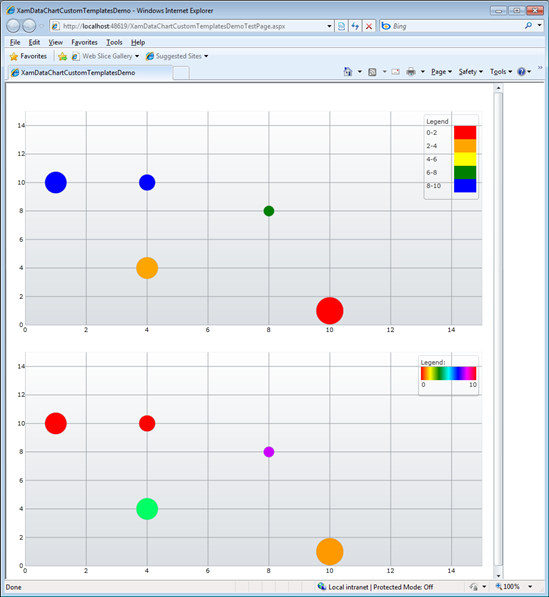
</igChart:XamDataChart>
6. アプリケーションを実行します。