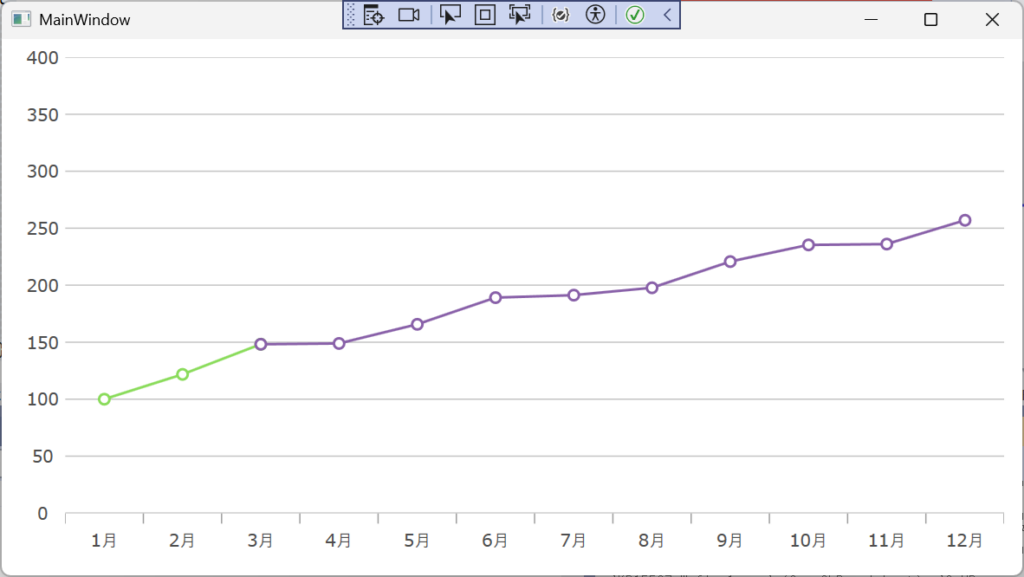
XamDataChart で折れ線グラフの色を途中で変えたい場合は、それぞれの色用に LineSeries シリーズを用意します。重なる部分については値に null を設定してください。
XAML側
<!-- MainWindow.xaml -->

<ig:XamDataChart ...>
    <ig:XamDataChart.Axes>
        ... (中略) ...
    </ig:XamDataChart.Axes>
    <ig:XamDataChart.Series>
        <!-- 1本目 (最初の部分用) -->
        <ig:LineSeries ItemsSource="{Binding SalesResults}"
            ValueMemberPath="Actual"
            XAxis="{Binding ElementName=xAxis}"
            YAxis="{Binding ElementName=yAxis}">
        </ig:LineSeries>
        <!-- 2本目 (色を変えた後の部分用) -->
        <ig:LineSeries ItemsSource="{Binding SalesResults}"
            ValueMemberPath="Prospect"
            XAxis="{Binding ElementName=xAxis}"
            YAxis="{Binding ElementName=yAxis}">
        </ig:LineSeries>
    </ig:XamDataChart.Series>
</ig:XamDataChart>
ViewModel 側
// MainWindowViewModel.cs
internal class MainWindowViewModel : ObservableObject
{
    public ObservableCollection<SalesResult> SalesResults { get; set; }

    public MainWindowViewModel()
    {
        SalesResults = new()
        {
            new () { Month = "1月", Actual = 100, Prospect = null },    // 重なる部分は null を入れておく
            new () { Month = "2月", Actual = 121.782, Prospect = null },
            new () { Month = "3月", Actual = 148.206, Prospect = 148.206 },
            new () { Month = "4月", Actual = null, Prospect = 148.911 },
            new () { Month = "5月", Actual = null, Prospect = 165.696 },
            new () { Month = "6月", Actual = null, Prospect = 189.118 },
            new () { Month = "7月", Actual = null, Prospect = 191.297 },
            new () { Month = "8月", Actual = null, Prospect = 197.730 },
            new () { Month = "9月", Actual = null, Prospect = 220.739 },
            new () { Month = "10月", Actual = null, Prospect = 235.363 },
            new () { Month = "11月", Actual = null, Prospect = 236.091 },
            new () { Month = "12月", Actual = null, Prospect = 256.984 },
        };
    }
}
実行結果