XamDataChartの棒グラフ(ColumnSeries)の棒の色を条件に応じて色分けする場合は、
- ColumnSeries の IsCustomCategoryStyleAllowed プロパティに True を設定する。
- ColumnSeries の AssigningCategoryStyle イベントにイベントハンドラーを追加し、その中で色分けを実装する。
でできます。
<!-- MainWindow.xaml側 -->
<ig:XamDataChart Width="300px" Height="300px">
    ...
    <ig:XamDataChart.Series>
        ...
        <ig:ColumnSeries ...
            IsCustomCategoryStyleAllowed="True"
            AssigningCategoryStyle="series1_AssigningCategoryStyle"/>
        ...
    </ig:XamDataChart.Series>
</ig:XamDataChart>
// MainWindow.xaml.cs 側
private void series1_AssigningCategoryStyle(object sender, Infragistics.Controls.Charts.AssigningCategoryStyleEventArgs args)
{
    // 点数が 80 点以上は緑
    if (((ScoreResult)args.GetItems(args.StartIndex, args.EndIndex)[0]).Score >= 80)
    {
        args.Fill = new SolidColorBrush(Colors.LightGreen);
        args.Stroke = new SolidColorBrush(Colors.Green);
    }
    // 点数が 80 点未満 50 点以上は黄色
    else if (((ScoreResult)args.GetItems(args.StartIndex, args.EndIndex)[0]).Score >= 50)
    {
        args.Fill = new SolidColorBrush(Colors.LightYellow);
        args.Stroke = new SolidColorBrush(Colors.Yellow);
    }
    // 点数が 50 点未満は赤
    else
    {
        args.Fill = new SolidColorBrush(Colors.Pink);
        args.Stroke = new SolidColorBrush(Colors.Red);
    }
}
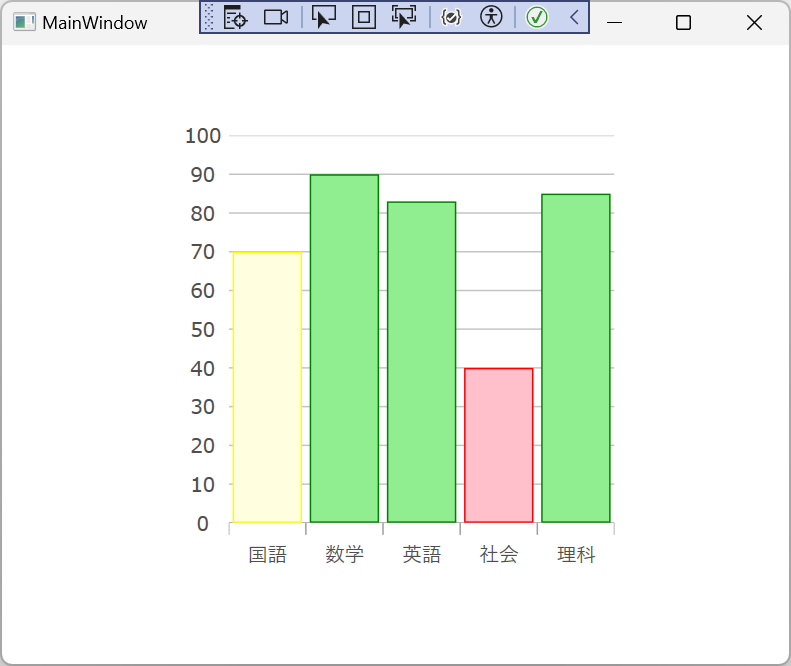
実行結果
関連ヘルプ ドキュメント、API リファレンス
- シリーズの強調表示
- IsCustomCategoryStyleAllowed プロパティ (CategorySeries)
- AssigningCategoryStyle イベント (CategorySeries)