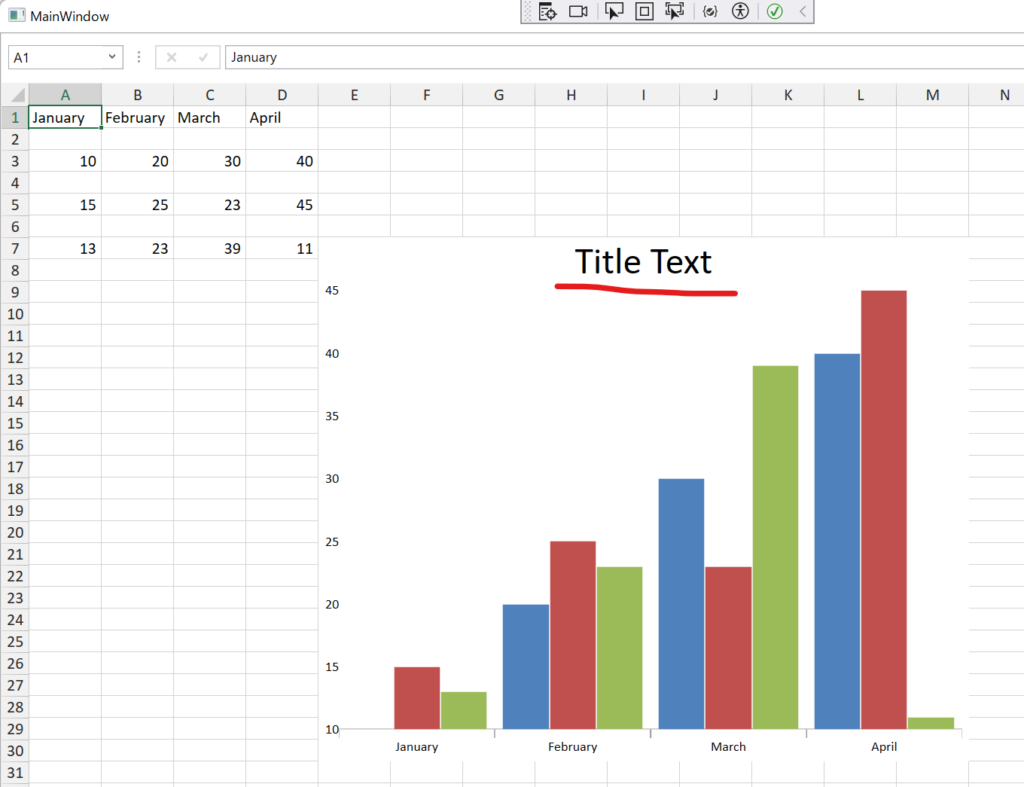
XamSpreadSheet に表示されるチャートにタイトルを設定し、表示させる方法をご案内します。
ChartTitle を使って以下のように実装をしてみてください。
テキストサイズ(Height)を設定する方法も載せていますので、ご覧ください。
WorksheetChart chart1 = sheet.Shapes.AddChart(Infragistics.Documents.Excel.Charts.ChartType.ColumnClustered, cell1, new Point(0, 0), cell2, new Point(100, 100));
chart1.SetSourceData("A1:D1,A3:D7", true);

// Create ChartTitle
ChartTitle chartTitle = new ChartTitle();

// Setting ChartTitle.Text
chartTitle.Text = new Infragistics.Documents.Excel.FormattedString("Title Text"); ? ココで "Title Text" というタイトルを設定しています。

// Setting Text Height
chartTitle.Text.GetFont(0).Height = 500; ? ちなみに、テキストサイズ(Height)を変更する場合はこちらを設定します。

// Setting ChartTitle
chart1.ChartTitle = chartTitle;